

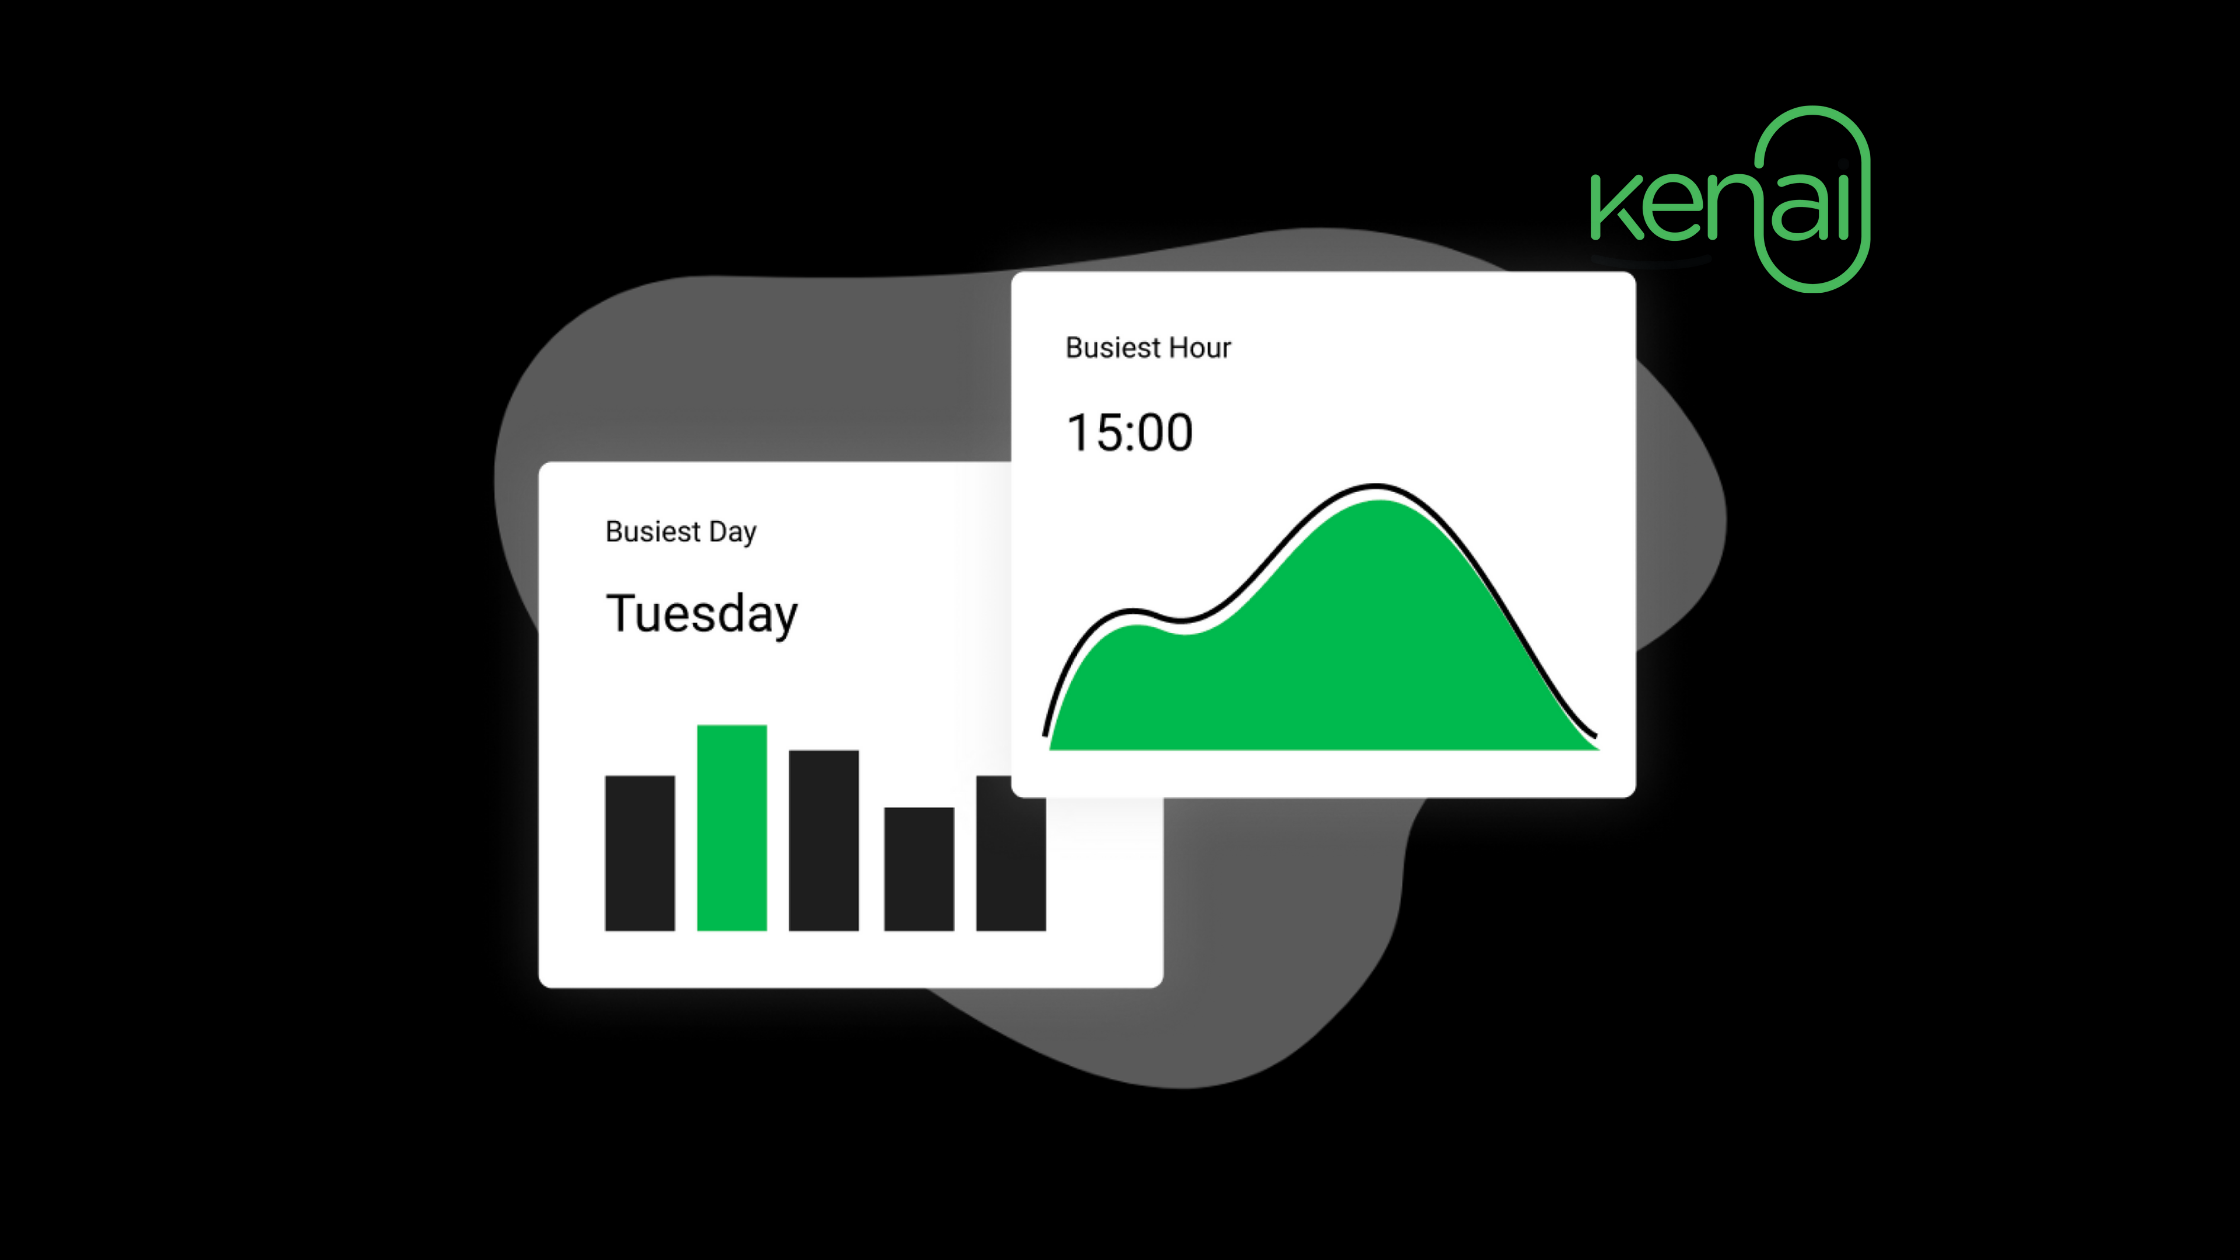

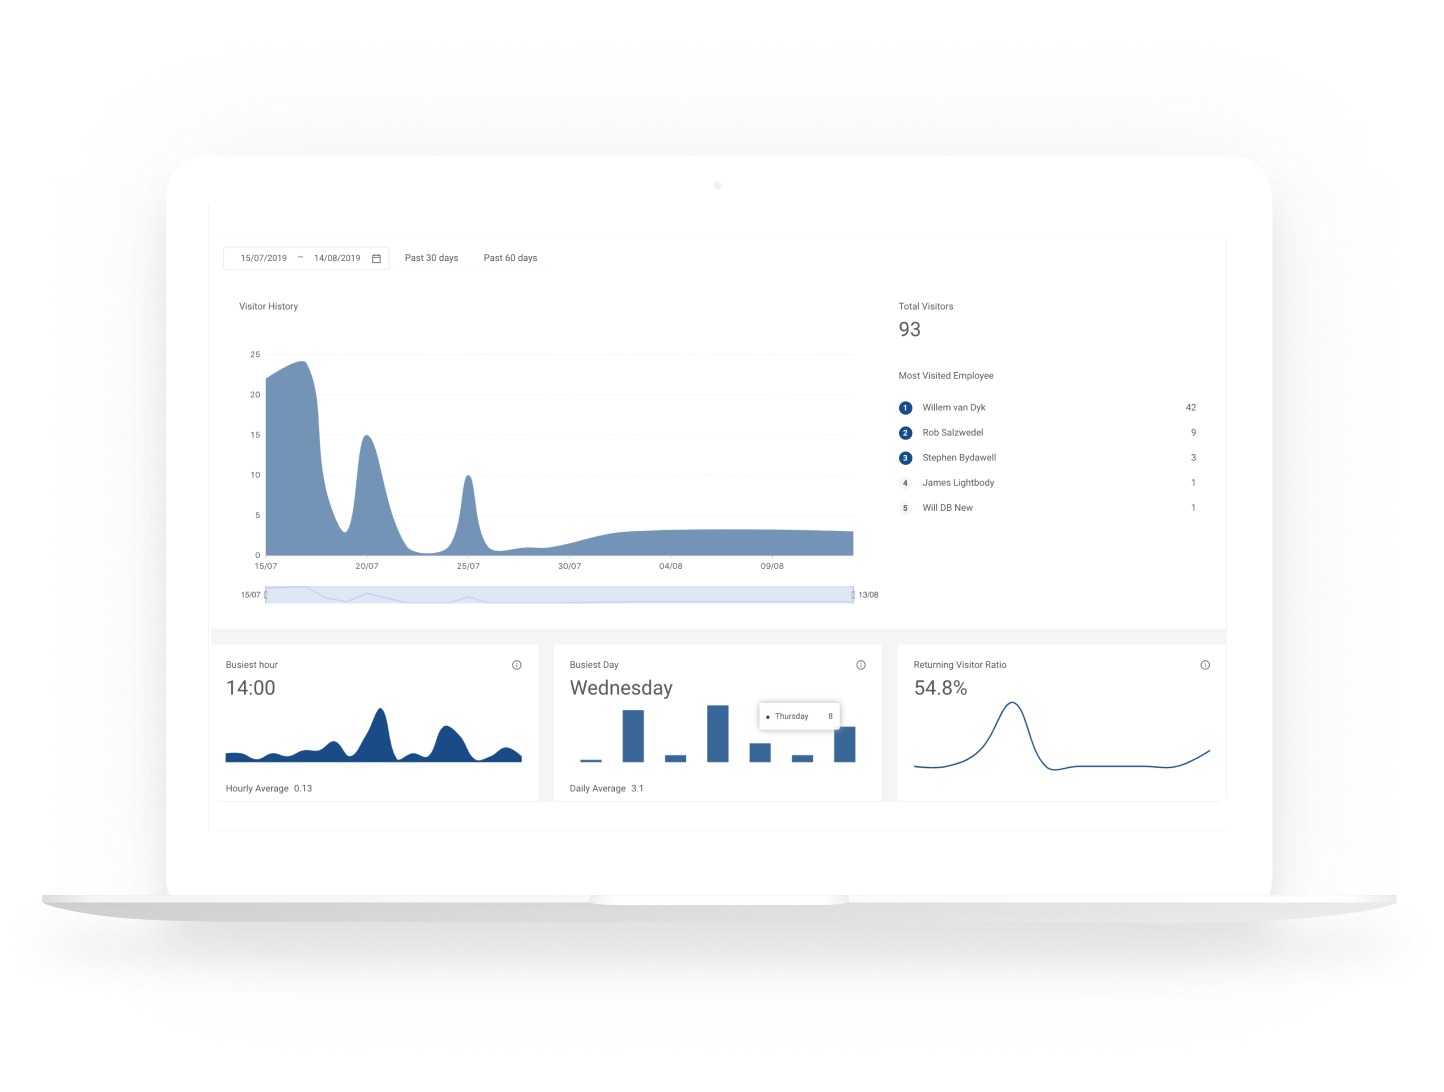
The Kenai dashboard already tells you who was in your building and when. But which are the busiest times in your lobby, and as a result, when should you focus on having meeting rooms available? Who gets visited most in your organisation, and how many of your visitors are repeat vs new visitors? Wonder no more with the introduction of Kenai visitor analytics.

Where to find it
If you're a Kenai subscriber, you’ll notice an analytics tab on the left of your web dashboard the next time you log in. Give it a click and watch your visitor data come to life. Which are your busiest hours and how long do return visitors take to sign in - you no longer have to take our word for it - simply check for yourself. We hope you’re pleased :)
The beauty of the analytics tab is that it’ll keep improving in time. Why? Because at Kenai we listen to our customers and develop what you want. So please, send us your wish-list for the analytics tab or any other part of the product and the Kenai team will get right on building it for you.
But for now, enjoy playing around with the analytics. Check out how your recognition rate has changed over time (it usually shows a steady increase), check your busiest lobby times and even see who is the most visited host for any time period.
Bye for now!
The Kenai Team
Interested in using Kenai for your business? Click here to find out more or get a quote.